|

|
Features
-
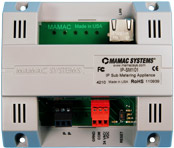 GENERAL: The Maverick IP Sub Metering Appliance has an
embedded lean TCP-IP stack including HTTP,
SMTP, DHCP, DNS, FTP, and ARP. GENERAL: The Maverick IP Sub Metering Appliance has an
embedded lean TCP-IP stack including HTTP,
SMTP, DHCP, DNS, FTP, and ARP.
The Maverick also has XML embedded with
formatted usage data. In this way, the Maverick
can communicate directly with any IT
system which has an XML parser. Similarly,
any simple JavaScript can be used to communicate
and acquire HTML data. These unique
features enable the Maverick to function as an
extremely low cost XML & HTML node for
large enterprise IT systems.
-
METERING: The Maverick SM-101 accepts a pulse input
(dry contact) directly from any electric, water
or gas meter. Computes consumption by multiplying
the pulse with the user programmed
meter coefficient and displays usage by the
minute, hour, week and month. The appliance
also displays the total accumulated pulses
from the meter. This usage data is available in
XML format to be imported into any database
management application. The data for hourly,
daily, weekly, monthly and the total pulses
is stored in non-volatile RAM. In this way, in
case of a power loss, only the current minute
data is lost.
The Sub Metering Maverick also has a time
countdown feature and displays the time
remaining prior to the next update for the
minute, hour, week and month consumption.
At a glance one can estimate if the current
consumption will exceed the previous usage.
If a new sub metering application is started,
a meter reset function is available under the
configuration page. With the input pulse disconnected,
if the meter reset icon is clicked,
the meter will reset and all accumulated data
including total accumulated pulses will be
flushed out and all counts will revert back to
zero.
-
EMAIL ALERTS: The biggest shortcoming of all existing sub
metering systems is their inability to directly
send email alerts and alarms. The Maverick
appliance has a very user friendly email alert
capability and can send email alerts to up to
two different addresses. Email alerts can be
configured for the minute, hour, day, week
or month consumption. If the usage exceeds
a predefined threshold, the appliance will
transmit an email alert. The Maverick SM-101
also has an option available to attach a CSV
log to the email alert. The user does not only
receive an alert but also can parse the log file
and review what the consumption has been
prior to the alert condition.
The Maverick appliance can also send email
alerts in case of a power outage. The appliance logs the time the power went out, and
when the power is restored, it sends an email
with a time stamp when the power went out
and when it was restored.
Similarly, the appliance can be configured to
send an email if the DHCP IP assignment has
been changed. If the Maverick is running as a
DHCP client, it can keep the users abreast of
its DHCP IP assignment and the user does not
have to discover the appliance.
-
PERIODIC EMAIL REPORTS: The Sub Metering Maverick also has a feature
to send consumption data periodic email
reports in CSV format every minute, hour,
day, week or month. These usage reports
can be imported into Excel, Word or any
other application which accepts CSV data
for analysis and archiving. This consumption
data is also available in XML format and can
be easily parsed by any application for data
mining purposes. The Minute report provides
1440 minutes ( 24 hour) rolling data for each
minute usage. The Hour report has 744 hours (31 days) of rolling hourly consumption
data, the Weekly report has 53 weeks of
data and the Monthly report accumulates 12
months of rolling consumption data.
The appliance can be configured to email
data for any or all desired periods to either
one or two email addresses. The user may
configure both multiple periodic email reports
and multiple email alerts at the same time.
-
DATA LOGGING: The logged data which is used by the periodic
email reports can also be viewed as bar
graphs. The Minute consumption data is displayed
by 60 bar graphs for each minute of
usage. The Hour data is displayed by 24 bar
graphs for each hour of consumption. The
Daily usage is displayed by 31 bar graphs for
each days usage, the Weekly data is shown
by 8 bar graphs for each week's consumption
and the Monthly usage is displayed by 12 bar
graphs for each months consumption.
The appliance provides a visual display of
consumption for any desired period. Data can
also be viewed as a CSV file and imported into
Word, Excel or any other application which
accepts CSV files.
|
|